4.1.1 Proportion of children and young people (a) in Grade 2 or 3; (b) at the end of primary education; and (c) at the end of lower secondary education achieving at least a minimum proficiency level in (i) reading and (ii) mathematics, by sex
4.1 By 2030, ensure that all girls and boys complete free, equitable and quality primary and secondary education leading to relevant and effective learning outcomes
4.1.1 Proportion of children and young people (a) in Grade 2 or 3; (b) at the end of primary education; and (c) at the end of lower secondary education achieving at least a minimum proficiency level in (i) reading and (ii) mathematics, by sex
Definition:
Percentage of children and young people achieving at least a minimum proficiency level in (i) reading and (ii) mathematics during primary education (Grade 2 or 3), at the end of primary education, and at the end of lower secondary education. The minimum proficiency level will be measured relative to new common reading and mathematics scales currently in development.
Purpose:
The indicator aims to measure the percentage of children and young people who have achieved the minimum learning outcomes in reading and mathematics during or at the end of the relevant stages of education.
Calculation method:
The number of children and/or young people at the relevant stage of education n in year t achieving or exceeding the pre-defined proficiency level in subject s expressed as a percentage of the number of children and/or young people at stage of education n, in year t, in any proficiency level in subject s.
MPLt,n,s = MPt,n,s
Pt,n
Where:
MPt,n,s = the number of children and young people at stage of education n, in year t, who have achieved or exceeded the minimum proficiency level in subject s.
Pt,n
Interpretation
Each measurement point by grade and subject has a verbal definition of what children should be able to achieve as a minimum. For each point of measurement, there is a threshold which divides students either above or below a minimum proficiency level. Each of the indicators for Indicator 4.1.1 are interpreted as follows, based on if the student falls above (i) or below (ii) the threshold:
- Above the minimum threshold: the proportion or percentage of students who have achieved at least the minimum proficiency level as defined by each assessment.
- Below the minimum threshold: the proportion or percentage of students who do not achieve the minimum proficiency level as defined by each assessment.
See Methodological Challenges for the minimum proficiency levels by assessments.
Indicator 4.1.1 comprises the following six indicators:
- 4.1.1.a (i) Proportion of children and young people in Grade 2 or 3 achieving at least a minimum proficiency level in reading, by sex
- 4.1.1.a (ii) Proportion of children and young people in Grade 2 or 3 achieving at least a minimum proficiency level in mathematics, by sex
- 4.1.1.b (i) Proportion of children and young people at the end of primary education achieving at least a minimum proficiency level in reading, by sex
- 4.1.1.b (ii) Proportion of children and young people at the end of primary education achieving at least a minimum proficiency level in mathematics, by sex
- 4.1.1.c (i) Proportion of children and young people at the end of lower secondary education achieving at least a minimum proficiency level in reading, by sex
- 4.1.1.c (ii) Proportion of children and young people at the end of lower secondary education achieving at least a minimum proficiency level in mathematics, by sex
Type of data source
For each of the six indicators of 4.1.1 for global reporting, the sources of data are:
- International assessments
- Regional assessments
- National assessments data collected through the Catalogue of Learning Assessments (CLA) and/or available in national reports
- Population-based assessments:
- Early Grade Reading Assessment (EGRA) and Early Grade Mathematics Assessment (EGMA)
- UNICEF Multiple Indicator Cluster Surveys (MICS)
- People’s Action for Learning (PAL) NETWORK (e.g. Annual Status of Education Report (ASER), UWEZO, etc.)
When the results are not nationally representative, a footnote should be added to the data point.
Methodological Challenge
The indicator faces the following methodological challenges:
A minimum proficiency level (MPL) is the benchmark of basic knowledge in a domain (mathematics, reading, etc.) measured through learning assessments. In September 2018, an agreement was reached on a verbal definition of the global MPL of reference for each of the areas and domains of Indicator 4.1.1 as described in the Minimum Proficiency Levels (MPLs): Outcomes of the consensus building meeting.
To ensure comparability across learning assessments, a verbal definition of MPL for each domain and levels between cross-national assessments (CNAs) was established by conducting an analysis of the performance level descriptors (PLDs)
to define the MPLs thresholds for reporting on Indicator 4.1.1.
| Minimum Proficiency Levels for Reading | |||
| Educational Level | Descriptor | Assessment PLD which aligns with descriptor | MPL assessment |
| Grade 2 | They read and comprehend most of written words, particularly familiar ones, and extract explicit information from sentences. | PASEC (Grade 2) – Level 3 | Level 3 |
| Grade 3 | Students read aloud written words accurately and fluently. They understand the overall meaning of sentences and short texts. Students identify the texts’ topic. | PISA-D – Level 1c | Level 2 |
| Uwezo – Standard 2 (Story with meaning) | Standard 2 (Story with meaning | ||
| PASEC 2014 (Grade 2) – Level 4 | Level 3 | ||
| Third ERCE (Grade 3) – Level 1 | Level 2 | ||
| MICS 6 – Foundational Reading Skills | Foundational Reading Skills | ||
| EGRA – Level 9 | Not specified | ||
| ASER – Standard 2 (story) | Standard 2 (story) | ||
| Grades 4 & 6 | Students interpret and give some explanations about the main and secondary ideas in different types of texts. They establish connections between main ideas on a text and their personal experiences as well as general knowledge. | SACMEQ 2007 – Level 3 | Level 3 |
| PASEC 2014 (Grade 6) – Level 2 | Level 3 | ||
| PIRLS 2011 – Low | Low | ||
| Second ERCE 2006 (Grade 6) – Level 2 | Level 1 (from Technical reports) | ||
| Grades 8 & 9 | Students establish connections between main ideas on different text types and the author’s intentions. They reflect and draw conclusions based on the text. | PISA 2015 – Level 2 | Level 2 |
| PILNA 2015 – Level 6 | Level 4 (Grade 4)
Level 5 (Grade 5) |
||
| Third ERCE 2014 (Grade 3) – Level 3 | Level 2 | ||
| PIRLS 2011 or 2016 - Intermediate | Low | ||
| SACMEQ 2007 – Level 6 | Level 3 | ||
| Third ERCE 2014 (Grade 6) – Level 1 | Level 2 | ||
| Minimum Proficiency Levels for Mathematics | |||
| Educational Level | Descriptor | Assessment PLD which aligns with descriptor | MPL in assessments |
| Grades 2-3 | Students demonstrate skills in number sense and computation, shape recognition and spatial orientation. | PASEC 2014 – Level 1 | Level 2 |
| PASEC 2014 – Level 2 | |||
| Third ERCE 2014 – Level 2 | Level 2 | ||
| Grades 4-6 | Students demonstrate skills in number sense and computation, basic measurement, reading, interpreting, and constructing graphs, spatial orientation, and number patterns. | PASEC 2014 – Level 1 | Level 2 |
| SACMEQ 2007 – Level 3 | Level 3 | ||
| SACMEQ 2007 – Level 4 | |||
| PILNA 2015 – Level 6 | Level 5 | ||
| Third ERCE 2014 – Level 1 | Level 2 | ||
| TIMSS 2015 – Intermediate International | Intermediate International | ||
| Grades 8 & 9 | Students demonstrate skills in computation, application problems, matching tables and graphs, and making use of algebraic representations. | PISA 2015 – Level 2 | Level 2 |
| TIMSS 2015 – Low International | Intermediate International | ||
[1] PLD: Performance level descriptors are descriptions of the performance levels to express the knowledge and skills required to achieve each performance level, by domain. They can be used to provide stakeholders with more information on what students at each performance level know and are able to do and what they need to know and be able to do to reach next performance level.
To address the challenges posed by the limited capacity of some countries to implement cross-national, regional, and national assessments, actions have been taken by the UIS and its partners. The UIS has proposed some options to link assessments together; one of these strategies is the Rosetta Stone, a subject-based psychometric linking approach (new data collection). The second one is the Policy linking approach, which consists on setting benchmarks, or cut scores, on learning assignments to align them with other assessments across countries or contexts (alignment with existing data).
The objective of the Rosetta Stone is to link together assessments, which have been administered in the recent past, to build concordance tables to compare their outcomes and benchmark national results to those of the regional assessments. This method enables countries to measure Sustainable Development Goal (SDG) 4 Indicator 4.1.1.
The Policy linking method makes use of a standard-setting methodology (the Angoff approach for those familiar with standard setting methodologies), long used in many countries, to set benchmarks (also known as “cut scores” or “thresholds”) on learning assessments. While it is an old standard-setting methodology, the UIS and its partners have now extended its use to help countries set benchmarks using the Global Proficiency Framework (GPF), a framework developed by multilateral donors and partners based on current national content and assessment frameworks across more than 100 countries. The GPF provides performance expectations/standards for learners in Grades 2-6 in reading and mathematics. By linking their national assessments to the GPF, countries and donors are able to compare learning outcomes across language groups in countries as well as across countries and over time, assuming all new assessments are subsequently linked to the GPF. Policy linking allows countries to use their existing national assessments or early grade reading and mathematics assessments to report against Indicator 4.1.1.
National learning assessments
It is possible for countries to report on Indicator 4.1.1 using national learning assessments (NLA), providing the following principles apply:
- NLA uses Item response theory (IRT);
- Results from NLA are available as the percentage of students by proficiency levels;
- Proficiency level descriptors are aligned to the global minimum proficiency level;
- The content of NLA sufficiently covers the Global Content Framework (GCF) in the relevant domain, either reading and/or mathematics. The Content Alignment Tool (CAT) allows to map the content of NLA to the GCF.[1]
- The NLA complies with the minimum level of good practices, based on an evaluation using the Procedural Alignment Tool (PAT) (the PAT is also available online). The PAT allows countries to assess the national level of compliance with a set of good practices and, most importantly, evaluate if a minimum level is reached.[2]
- Footnotes are added to the data points (e.g. name of the national assessment, minimum proficiency level, and grade)
[1] The CAT includes questionnaire which allows respondents to determine the level of alignment of their NLA with the GCF in reading and mathematics. The exercise can be completed with guidance from the reference document, and with support from the UIS.
[2] The PAT requires respondents to answer a series of questions on their implementation of NLA based on five major groupings (capacity and technical standards, instrument development, linguistic control, sampling, and data control, analysis and reporting). Upon completion of the questionnaire, a report is produced (PAT Report).
In 2016, 263 million children, adolescents and youth were out of school, representing nearly one-fifth of the global population of this age group. 63 million, or 24% of the total, are children of primary school age (typically 6 to 11 years old); 61 million, or 23% of the total, are adolescents of lower secondary school age (typically 12 to 14 years old); and 139 million, or 53% of the total, are youth of upper secondary school age (about 15 to 17 years old). Not all these kids will be permanently outside school, some will re-join the educational system and, eventually, complete late, while some of them will enter late. The quantity varies per country and region and demands some adjustment in the estimate of Indicator 4.1.1. One pending methodological discussion is how to adjust to reflect all the population. In 2017, the UIS proposed to make adjustments using the out-of-school children (OOSC)[1] and the completion rates.
[1] UIS (2017a). More than one-half of children and adolescents are not learning worldwide. Montreal and UIS (2017b). Counting the number of children not learning: Methodology for a global composite indicator for education. Montreal.
Protocole for reporting
In reporting on Indicator 4.1.1, questions may arise in relation to:
- the selection of domains for reporting on reading and mathematics, based on those included in a given assessment; and
- the selection of the source of data.
Protocols are given to address these challenges.
- Mapping of grade to measurement point
- Grade 2 or 3: Plus one year when primary lasts more than 4 years according to ISCED[5] levels in the country
- End of primary: Plus or minus one year from the last year of primary according to ISCED level mapping in the country
- End of lower secondary: Plus two or minus one of last year of lower secondary according to ISCED level mapping in the country
- Mapping of domains to reading or mathematics
- Reading:
- When a country has no assessment in reading, alternative domains like language or writing should be used.
- When results are available in different languages, the official or most relevant language in the country should be used.
- Mathematics: alternative domains can also be considered and used for reporting.
| Protocol for reporting on Indicator 4.1.1 | |||||
| Measurement point | Type of assessment | Which grade to select | |||
| School-based | Population- based | ||||
| Cross-national | National | ||||
| Grade 2 or 3 | LLECE
PASEC TIMSS PIRLS |
Yes | MICS 6
EGRA EGMA PAL Network |
Plus one year
when primary lasts more than 4 years according to ISCED level in the country |
|
| End of primary | LLECE
PASEC SACMEQ PILNA SEAMEO TIMSS PIRLS |
Yes | PAL Network | Plus or minus one
year of last year of primary according to ISCED levels in the country |
|
| End of lower
secondary |
TIMSS
PISA PISA-D |
Yes | Young Lives | Plus two or minus
one of last year of lower secondary according to ISCED levels in the country |
|
| Definition of minimum level until 2018 release | Those defined by each assessment by point of measurement and domain | ||||
| Definition of minimum level from 2019 | According to alignment as adopted by Global Alliance to Monitoring Learning (GAML) and Technical Cooperation Group (TCG) | ||||
| Grade for end of primary and end of lower secondary | As defined by the ISCED levels in each country | ||||
| Validation | Sent by the UIS for countries’ approval | ||||
Notes: * TIMSS/PIRLS Grade 4: these results are allocated to the end of primary when, according to the ISCED levels in a given country, there are 4 grades in primary. When primary has more than 4 grades, they are allocated to Grade 2 or 3. ** The UIS advises to complement this indicator with out-of-school children indicators.
LLECE: El Laboratorio Latinoamericano de Evaluación de la Calidad de la Educación
PILNA: Pacific Islands Literacy and Numeracy Assessment
PISA: Programme for International Student Assessment
SEAMEO: Southeast Asian Ministers of Education Organization
Source: UIS.
- Decision tree for sources of data
In the selection of the source of data to use for reporting, the assessment which maps the best to the grade should always be the preferred choice of source of data. Until the equating across assessments is complete, cross-national assessments for which data has been collected within the window of reporting should be the second preferred choice, as it allows comparisons with other countries. A national assessment should be selected only if no alternative program for reporting is available within the window of time for reporting.
In the situation where a country has different sources of data available for reporting for a given year and multiple levels, for instance ERCE for Grade 2 or 3, and PISA or TIMSS for the end of lower secondary, only one level (and domain) should be used.
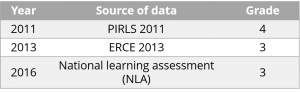
A concrete example illustrates the selection process: Honduras has learning assessments data for Indicator 4.1.1.a (reading) for different years (2011, 2013, 2016). These data have been generated from national, regional, and international learning assessment programs:
| Year | Source of data | Grade |
| 2011 | PIRLS 2011 | 4 |
| 2013 | ERCE 2013 | 3 |
| 2016 | National Learning Assessment (NLA) | 3 |
In this example, the assessment program to use for reporting on Indicator 4.1.1.a (reading) for Honduras should be ERCE 2013. The alternative of PIRLS for 2011 was completed for Grade 4, which is one grade above the intended grade of the indicator to measure (either Grade 2 or 3). ERCE 2013 and the NLA of 2016 both assess Grade 3 students could appear as are better options than PIRLS 2011. However, ERCE, a regional assessment, prevails over Honduras NLA, as according to the priority of data sources indicated above and since it facilitates comparisons between different countries which have implemented a same assessment.
Until the process of equating international, regional and national assessments is complete, it is important to use only one source of information so progress can be tracked on a comparable basis.
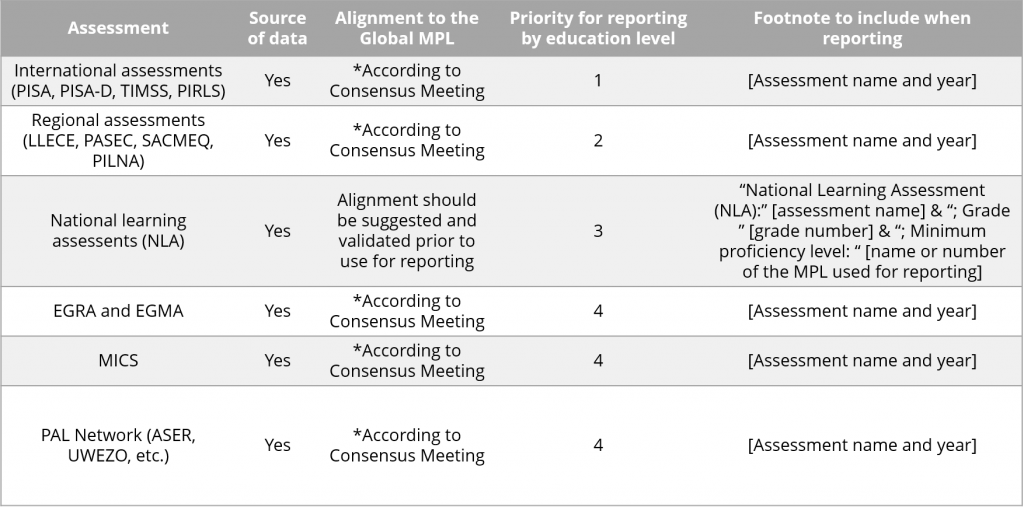
The following table illustrates the priorities in the selection of data sources.
| Assessment | Source of data | Alignment to the Global MPL | Priority for reporting by education level | Footnotes to include when reporting |
| International assessments
(PISA, PISA-D, TIMSS, PIRLS) |
Yes | *According to Consensus Meeting | 1 | [Assessment name and year] |
| Regional assessments (LLECE, PASEC, SACMEQ, PILNA) | Yes | *According to Consensus Meeting | 2 | [Assessment name and year] |
| National learning assessments (NLA) | Yes | Alignment should be suggested and validated prior to use for reporting | 3 | “National Learning Assessment (NLA):” [assessment name] & “; Grade ” [grade number] & “; Minimum proficiency level: “ [name or number of the MPL used for reporting] |
| EGRA and EGMA | Yes | *According to Consensus Meeting | 4 | [Assessment name and year] |
| MICS | Yes | *According to Consensus Meeting | 4 | [Assessment name and year] |
| PAL NETWORK
(ASER, UWEZO, etc.) |
Yes | *According to Consensus Meeting | 4 | [Assessment name and year] |
* See Minimum Proficiency Levels (MPLs): Outcomes of the consensus building meeting
Source: UNESCO Institute for Statistics (UIS)
- Metadata points
Footnotes should added to data points (e.g. name of the assessment, minimum proficiency level, and grade)
- Grade 2 or 3: Plus one year when primary lasts more than 4 years according to ISCED[1] levels in the country
- End of primary: Plus or minus one year from the last year of primary according to ISCED level mapping in the country
- End of lower secondary: Plus two or minus one of last year of lower secondary according to ISCED level mapping in the country
[1] ISCED: International Standard Classification of Education
- Reading:
- When a country has no assessment in reading, alternative domains like language or writing should be used.
- When results are available in different languages, the official or most relevant language in the country should be used.
- Mathematics: alternative domains can also be considered and used for reporting.
| Protocol for reporting on Indicator 4.1.1 | |||||
| Measurement point | Type of assessment | Which grade to select | |||
| School-based | Population- based | ||||
| Cross-national | National | ||||
| Grade 2 or 3 | LLECE
PASEC TIMSS PIRLS |
Yes | MICS 6
EGRA EGMA PAL Network |
Plus one year
when primary lasts more than 4 years according to ISCED level in the country |
|
| End of primary | LLECE
PASEC SACMEQ PILNA SEAMEO TIMSS PIRLS |
Yes | PAL Network | Plus or minus one
year of last year of primary according to ISCED levels in the country |
|
| End of lower
secondary |
TIMSS
PISA PISA-D |
Yes | Young Lives | Plus two or minus
one of last year of lower secondary according to ISCED levels in the country |
|
| Definition of minimum level until 2018 release | Those defined by each assessment by point of measurement and domain | ||||
| Definition of minimum level from 2019 | According to alignment as adopted by Global Alliance to Monitoring Learning (GAML) and Technical Cooperation Group (TCG) | ||||
| Grade for end of primary and end of lower secondary | As defined by the ISCED levels in each country | ||||
| Validation | Sent by the UIS for countries’ approval | ||||
Notes: * TIMSS/PIRLS Grade 4: these results are allocated to the end of primary when, according to the ISCED levels in a given country, there are 4 grades in primary. When primary has more than 4 grades, they are allocated to Grade 2 or 3. ** The UIS advises to complement this indicator with out-of-school children indicators.
LLECE: El Laboratorio Latinoamericano de Evaluación de la Calidad de la Educación
PILNA: Pacific Islands Literacy and Numeracy Assessment
PISA: Programme for International Student Assessment
SEAMEO: Southeast Asian Ministers of Education Organization
Source: UIS.
In the selection of the source of data to use for reporting, the assessment which maps the best to the grade should always be the preferred choice of source of data. Until the equating across assessments is complete, cross-national assessments for which data has been collected within the window of reporting should be the second preferred choice, as it allows comparisons with other countries. A national assessment should be selected only if no alternative program for reporting is available within the window of time for reporting.
In the situation where a country has different sources of data available for reporting for a given year and multiple levels, for instance ERCE for Grade 2 or 3, and PISA or TIMSS for the end of lower secondary, only one level (and domain) should be used.
A concrete example illustrates the selection process: Honduras has learning assessments data for Indicator 4.1.1.a (reading) for different years (2011, 2013, 2016). These data have been generated from national, regional, and international learning assessment programs:
 In this example, the assessment program to use for reporting on Indicator 4.1.1.a (reading) for Honduras should be ERCE 2013. The alternative of PIRLS for 2011 was completed for Grade 4, which is one grade above the intended grade of the indicator to measure (either Grade 2 or 3). ERCE 2013 and the NLA of 2016 both assess Grade 3 students could appear as are better options than PIRLS 2011. However, ERCE, a regional assessment, prevails over Honduras NLA, as according to the priority of data sources indicated above and since it facilitates comparisons between different countries which have implemented a same assessment.
Until the process of equating international, regional and national assessments is complete, it is important to use only one source of information so progress can be tracked on a comparable basis.
The following table illustrates the priorities in the selection of data sources.
* See Minimum Proficiency Levels (MPLs): Outcomes of the consensus building meeting
Source: UNESCO Institute for Statistics (UIS)
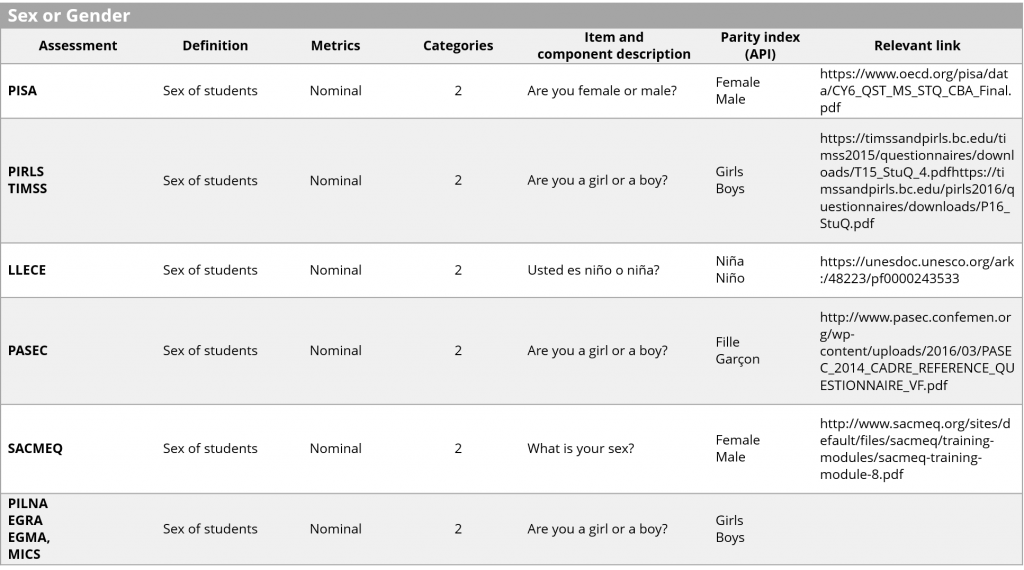
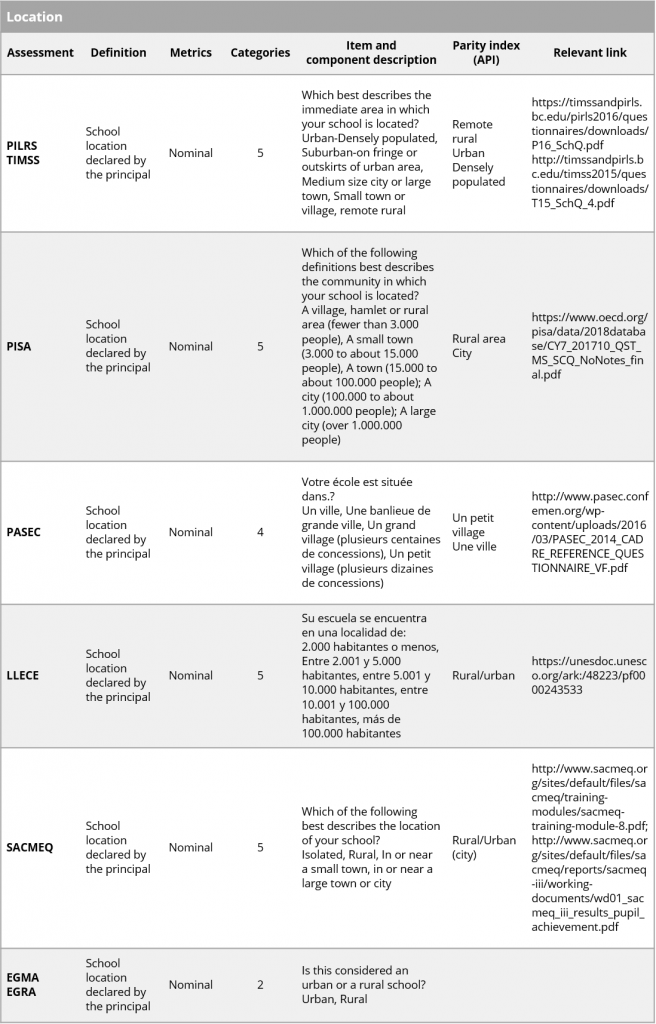
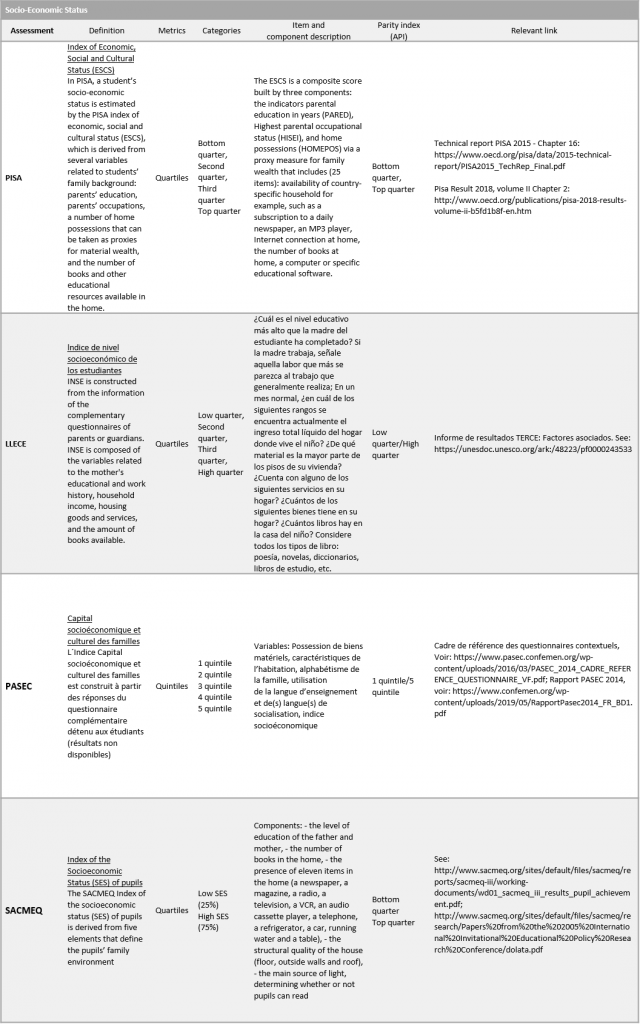
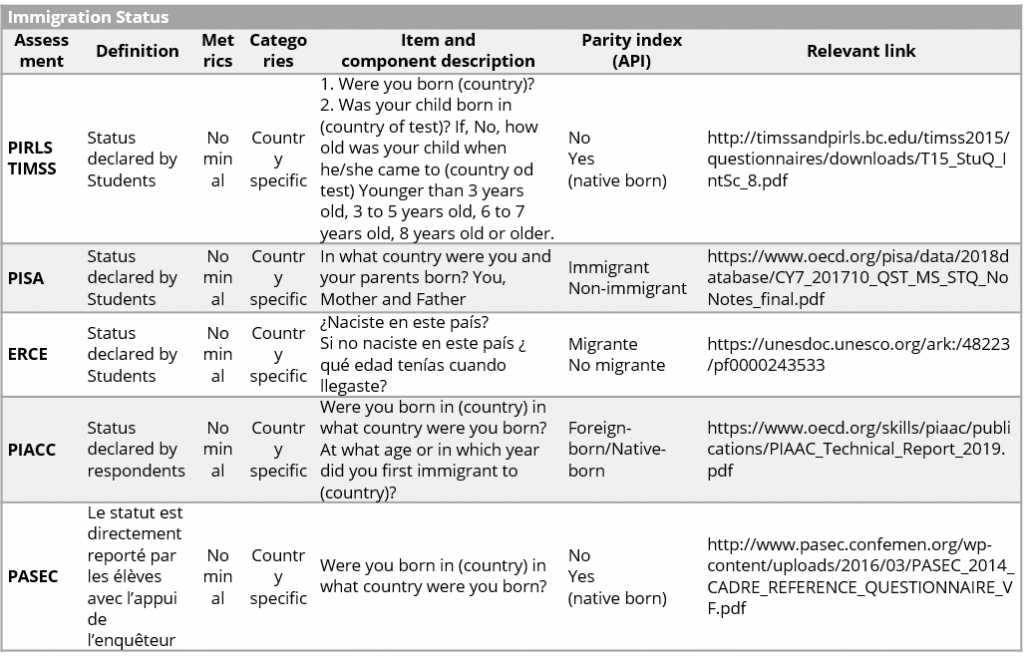
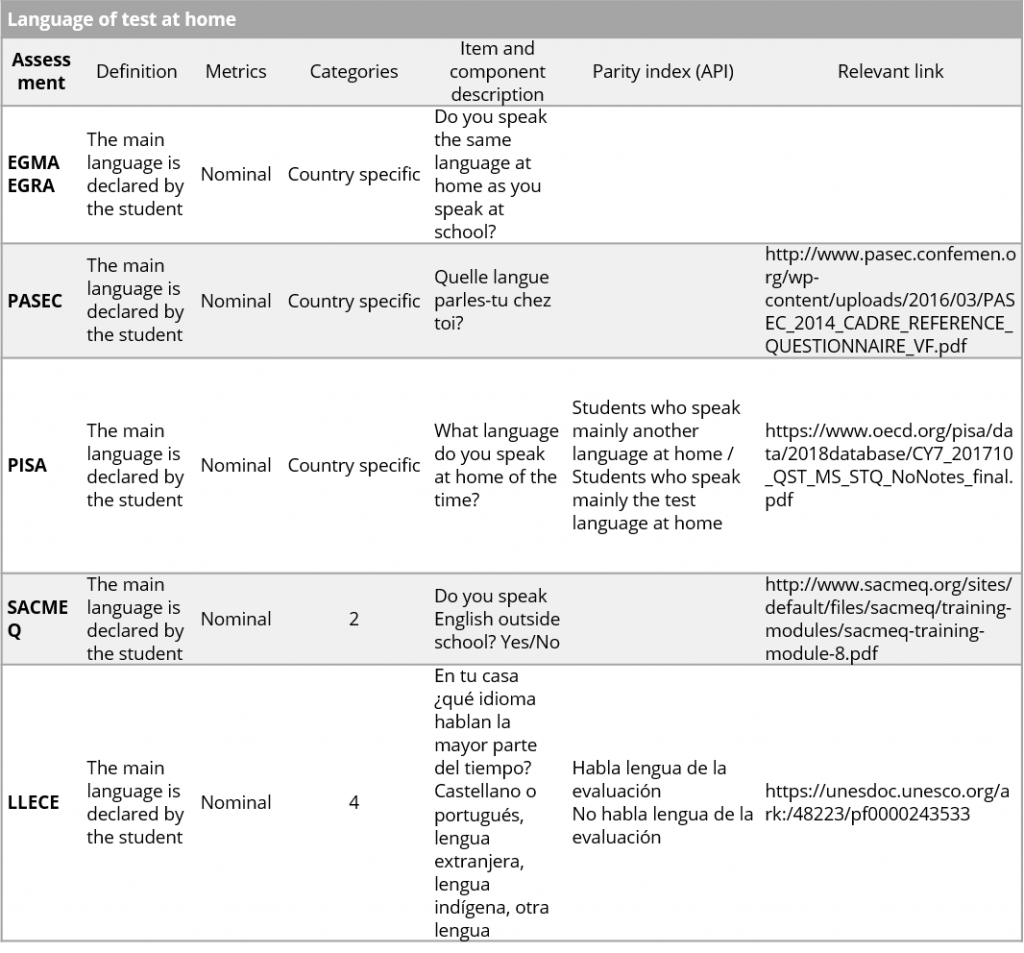
Disaggregation
Indicators are published disaggregated by age or age-group, sex, location, socio-economic status, immigrant status, ethnicity and language of the test at home. Parity indexes are estimated in the reporting of Indicator 4.5.1. Information on the disaggregation of variable for Indicator 4.1.1 are presented in the following tables.
Limitation and comments
Learning outcomes from cross-national learning assessment are directly comparable for all countries which participated in the same cross-national learning assessments. However, these outcomes are not comparable across different cross-national learning assessments or with national learning assessments. A level of comparability of learning outcomes across assessments could be achieved by using different methodologies, each with varying standard errors. The period of 2020-2021 will shed light on the standard errors’ size for these methodologies.
The comparability of learning outcomes over time has additional complications, which require, ideally, to design and implement a set of comparable items as anchors in advance. Methodological developments are underway to address comparability of assessments outcomes over time.
Acronyms
CAT Content Alignment Tool
CLA Catalogue of Learning Assessments
CNA Cross-national assessments
GAML Global Alliance to Monitoring Learning
GCF Global Content Framework
GPF Global Proficiency Framework
IRT Item response theory
ISCED International Standard Classification of Education
MPL Minimum proficiency level
PAT Procedural Alignment Tool
PLD Performance level descriptors
SDG Sustainable Development Goal
TCG Technical Cooperation Group
Assessments
ASER Annual Status of Education Report
EGRA Early Grade Reading Assessment
EGMA Early Grade Mathematics Assessment
ERCE Regional Comparative and Explanatory Study
LLECE El Laboratorio Latinoamericano de Evaluación de la Calidad de la Educación
MICS Multiple Indicator Cluster Surveys
PAL Network People’s Action for Learning Network
PASEC Programme d’analyse des systèmes éducatifs de la confemen
PIACC Programme for the International Assessment of Adult Competencies
PILNA Pacific Islands Literacy and Numeracy Assessment
PIRLS Progress in International Reading Literacy Study
PISA Programme for International Student Assessment
PISA-D Programme for International Student Assessment for Development
SACMEQ Southern and Eastern Africa Consortium for Monitoring Education Quality
SEAMEO Southeast Asian Ministers of Education Organization
TIMSS Trends in International Mathematics and Science Study
UWEZO (not an acronym)